PETG (Polyethylene Terephthalate Glycol)

These printer parameters were set on Ultimaker 2 and Ultimaker 2+ Extended printers with a 0.6 mm nozzle. These parameters provided the best results when printing PETG for material testing. Note that the speeds on this table are percentages of the Cura speeds (shown on the main page).

Data Obtained from Test:


In the last table, one data point is missing possibly due to issues with the data collection software. There are plenty of other points to gather information on this material.
Data resolution and uncertainty for all mechanical tests are compliant with the machine manufacturer's tolerances. To view these please the visit manufacturer's websites.
Tensile test specimen print orientation on print bed.
Tensile Testing Results
ASTM D638 and Type V specimens were used used to perform this test. Tensile tests are common mechanical tests used to determine a material's properties when a tension load is applied. Data collection was based off of the maximum load applied before the specimen began to plastically deform, or started to fail. Stress is applied to a specimen and defined as force per area; this causes strain to occur, which is a change in shape (or deformation) of the specimen. Elastic Modulus is a material's resistance to elastically deform. A flexible material will have a lower elastic modulus, whereas a stiffer material would have a higher value. These properties were all determined from this test. The machine used for this test was the Instron 4301 Compression Tension Tensile Tester.
The left image shows before the test took place. The gif on the right shows during the test and when the specimen breaks.


These images show some of the specimens after the tensile testing took place. Ductile fractures are shown to the left, and brittle to the right.

Tensile Specimen Specs
Data Obtained from Test:

Rockwell Hardness Testing Results

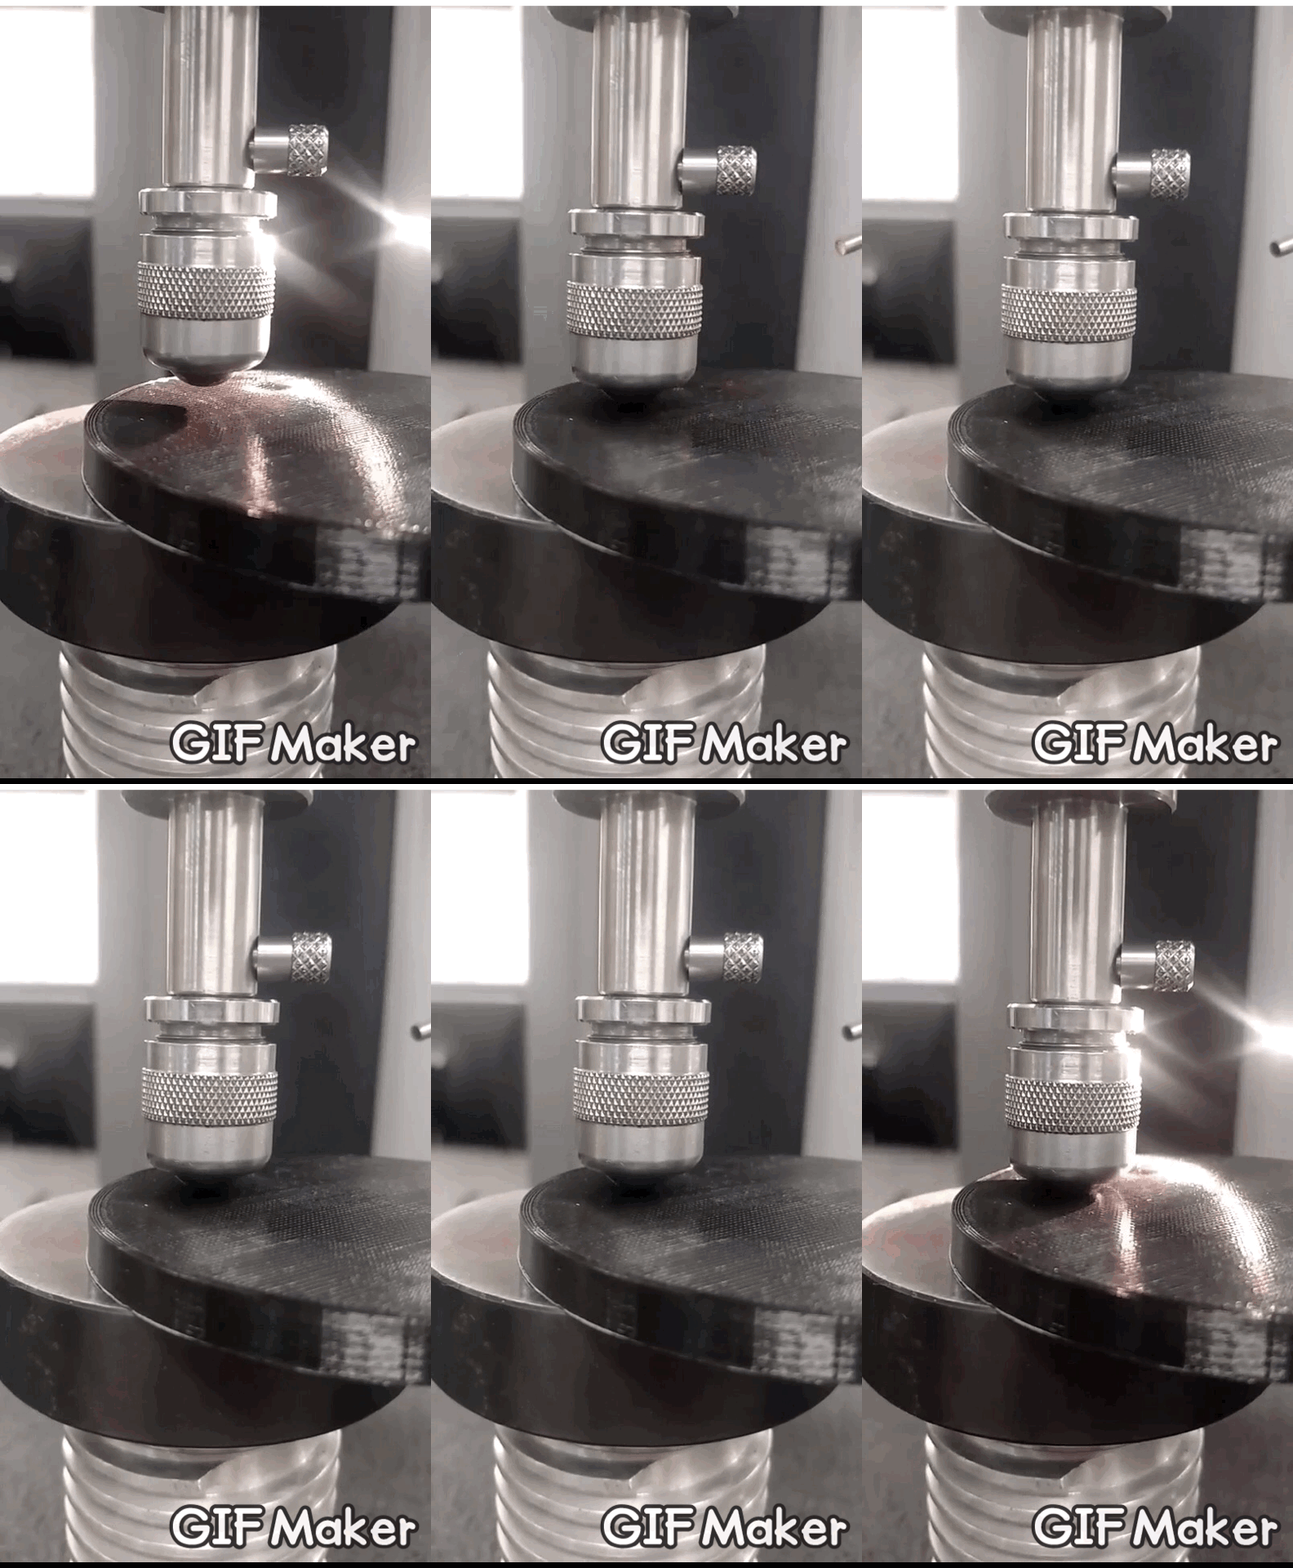
The above images show the test specimens after testing. The indenter mark is more visible in the non-elastic materials. In the flexible materials, a marker was used to identify where the indenter had previously tested because those were harder to see.
According to ASTM D785, Rockwell Hardness tests measure a material's resistance to indentation when a load is applied. Using a defined scale (R, L, M, E, or K for ASTM D785), a steel ball of a certain diameter is used to make an indentation into the material. A minor load is applied to the surface (defines the zero point) then increased to a major load, and then back down to the minor load again. The indentation depth is measured and converted to a hardness value. The higher the number, the harder the material is. For this material testing, the Rockwell R scale was used on an Instron Wilson Rockwell Series 2000 Hardness Tester. The indenter diameter, minor load, and major load was 0.5", 10 kg, and 60 kg, respectively. Five hardness readings were taken on each test specimen and then the average was determined. The data table below displays the average hardness values calculated.


Hardness test specimen print orientation on print bed.
Hardness Specimen Specs

Data Obtained from Test:

Charpy Impact Toughness Testing Results


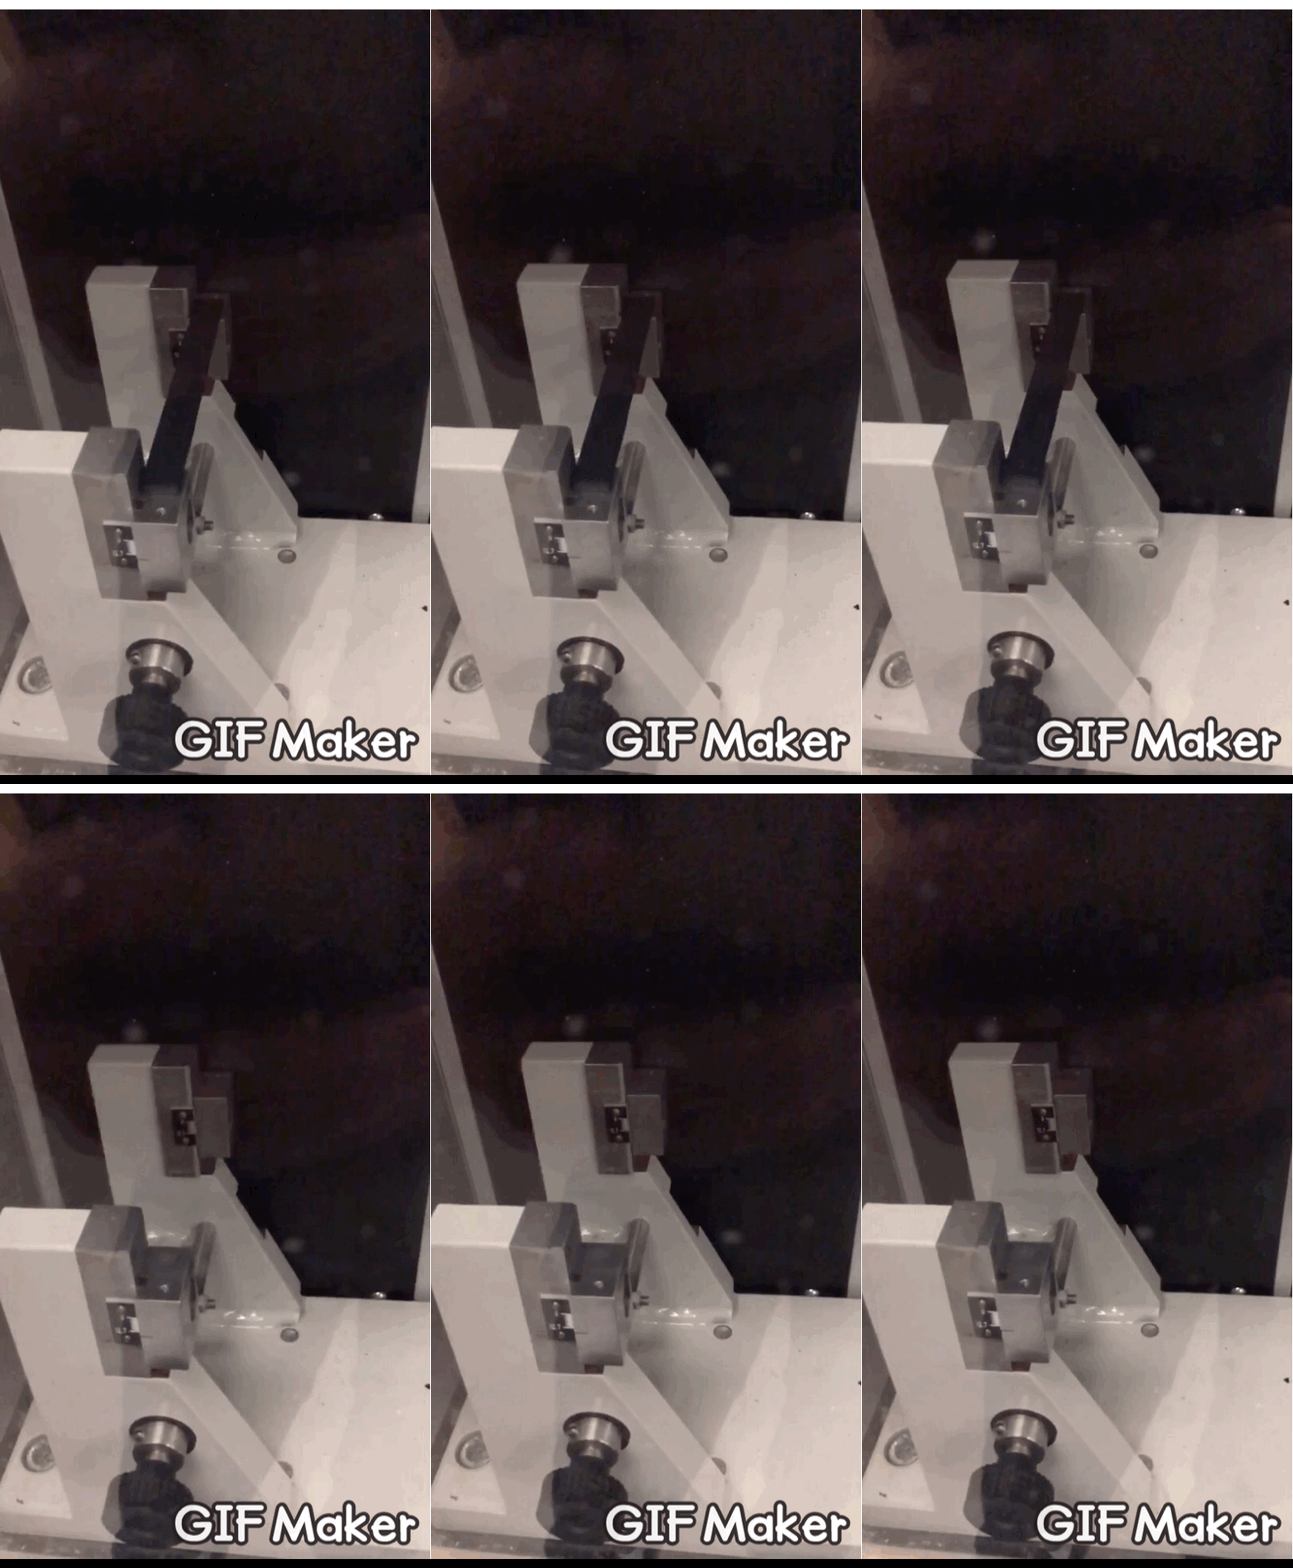
The images to the left show the test specimens after the test took place. Two of the six materials had specimens not break, thus showing what the pieces looked like before testing.
Using ASTM D6110, it was possible to determine each material's resistance to break due to flexural shock when struck by a pendulum-type hammer. Dimensions of test specimens are indicated within this ASTM standard; the notch in each piece creates a stress concentration, thus causing a brittle fracture to occur. The data collected represents energy absorbed by the material when struck by the hammer. The equipment used to perform this test was a Galdabini Impact Tester.


Toughness Specimen Specs
Toughness test specimen print orientation on print bed.


Environmental Testing
Test specimens underwent different environmental treatments and were compared to baseline results to find if material properties were altered. Specimens were treated for 1-3 weeks and tested after each week. The parameters of the environmental chambers are listed below.

Humidity Treatment
Heat Treatment
UVA Treatment
Specimens were placed in this humidity chamber for 1 , 2, or 3 week periods. This chamber was kept at a 99% humidity level for the 3 week period with an average temperature of 30 ± 1 °C.
Specimens were placed in this heat chamber for 1 , 2, or 3 week periods. This chamber was kept at an average temperature of 35 ± 1 °C using a Solar Glo PT2193 160 Watt.
Specimens were placed in this heat chamber for 1 , 2, or 3 week periods. This chamber was kept at an average temperature of 29 ± 1 °C using an UVA 150 Watt.


The figure above indicates interaction profiles between the 3 different factors that were used during these test Materials, Environment, and Time. From these results parallel lines indicate little to no interaction between different factors. When the line cross each other that is an indication of interaction. The top middle plot show few parallel lines and multiple overlapping lines therefore there is a clear interaction between materials and the environments they were exposed to. The other plots show relatively parallel lines indicating that these factors have little to no interaction with each other.
The Effect Summary above on the left is used to show the P-values if a test is or is not statistically valid. If the test is statically valid the P-value<0.05 if the P-value>0.05 the test is considered not statistically valid. For the above tests the materials and environmental factors were considered statistically valid yet the time factor was not.
The Effect Test above on the right is used to show the F Ratio versus the Probability. The lower probability is more desirable.
The Effect Summary above on the left is used to show the P-values if a test is or is not statistically valid. If the test is statically valid the P-value<0.05 if the P-value>0.05 the test is considered not statistically valid. For the above tests the materials and environmental factors were considered statistically valid yet the time factor was not.


The figure above indicates interaction profiles between the 3 different factors that were used during these test Materials, Environment, and Time. From these results parallel lines indicate little to no interaction between different factors. When the line cross each other that is an indication of interaction. The top middle plot show few parallel lines and multiple overlapping lines therefore there is a clear interaction between materials and the environments they were exposed to. The other plots show relatively parallel lines indicating that these factors have little to no interaction with each other.
The Effect Test above on the right is used to show the F Ratio versus the Probability. The lower probability is more desirable.


The Effect Summary above on the left is used to show the P-values if a test is or is not statistically valid. If the test is statically valid the P-value<0.05 if the P-value>0.05 the test is considered not statistically valid. For the above tests the materials and environmental factors were considered statistically valid yet the time factor was not.
The Effect Test above on the right is used to show the F Ratio versus the Probability. The lower probability is more desirable.

The figure above indicates interaction profiles between the 3 different factors that were used during these test Materials, Environment, and Time. From these results parallel lines indicate little to no interaction between different factors. When the line cross each other that is an indication of interaction. The top middle plot show few parallel lines and multiple overlapping lines therefore there is a clear interaction between materials and the environments they were exposed to. The other plots show relatively parallel lines indicating that these factors have little to no interaction with each other.